Эта страница предназначена исключительно для справочных целей. Некоторые услуги и функции могут быть недоступны в вашем регионе.

OKX Crypto Rewind 2024: Which Trading Persona Are You?

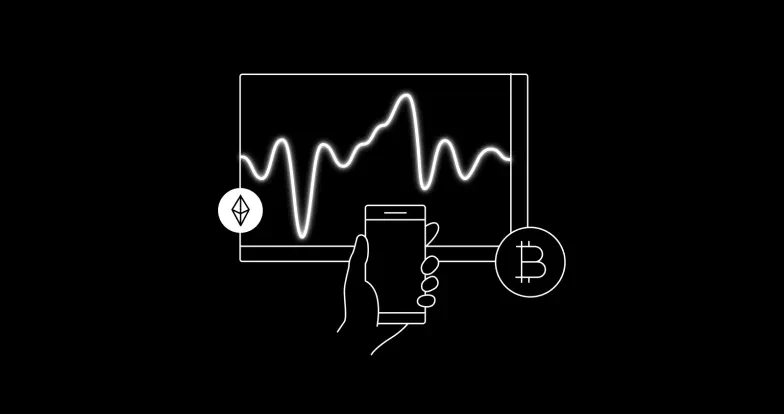
Today we're launching our own Crypto Rewind 2024, where people who use our apps as well as on-chain wallet users can view a customized report of their trading habits this year and see which of over 20 distinct trading personas fits them best.

We've identified many distinct trading personas within our community, from methodical evening traders ("Moonwalkers") and "Meme Hunters" to technical analysis wizards ("Chartmasters"). Many OKX users were "Diamond Hands" who held steadily despite volatility, "Chart Wizards" who took advantage of subtle market patterns, or "Multi-Chain Explorers" who used our Wallet to navigate across more than 100 blockchains with ease.

Anyone can visit these links via web or OKX App to generate their reports, using data from their trading journeys across both CeFi and DeFi.

This year, we've also made it possible for users of many onchain wallets (including MetaMask, Phantom, Unisat, Xverse and WalletConnect) to connect and view our analysis of their DEX and onchain transaction activity. Beyond OKX Wallet users, we welcome EVM-compatible wallets, Bitcoin or Solana wallets including MetaMask, Phantom, Unisat, Xverse, and WalletConnect.

It's easier than ever to share the OKX Crypto Rewind experience with others. Anyone can instantly share their personalized report within their communities—whether they want to engage with friends, trading groups, or larger online forums. It’s a great way to showcase trading journeys and insights with ease.

People who generate a report also receive a free digital collectible marking their 2024 journey - a unique snapshot for their personal collection.

As a new year begins, we invite our community, including onchain wallet users, to see what their 2024 trading journey reveals about them - and what opportunities may await in 2025.

Дисклеймер
Материалы предоставлены исключительно в ознакомительных целях и могут включать информацию о продуктах, которые недоступны в вашем регионе. Они не являются инвестиционным советом или рекомендацией, предложением или приглашением к покупке, продаже или удержанию криптовалюты / цифровых активов, советом в финансовой, бухгалтерской, юридической или налоговой сфере. Криптовалютные и цифровые активы, в том числе стейблкоины, сопряжены с высокими рисками и подвержены сильным ценовым колебаниям. Тщательно оцените финансовое состояние и определите, подходит ли вам торговля и удерживание цифровых активов. По вопросам, связанным с вашими конкретными обстоятельствами, обращайтесь к специалистам в области законодательства, налогов или инвестиций. Информация, представленная на этой странице (включая рыночные и статистические данные, если таковые имеются), предназначена исключительно для ознакомления. При подготовке статьи были приняты все меры предосторожности, однако автор не несет ответственности за фактические ошибки и упущения.

© OKX, 2025. Эту статью можно копировать и распространять как полностью, так и в цитатах объемом не более 100 слов, при условии некоммерческого использования. При любом копировании или распространении всей статьи должно быть указано: «Разрешение на использование получено от владельца авторских прав на эту статью — © OKX, 2025. Цитаты должны содержать ссылку на название статьи и ее автора, например: «Название статьи, [имя автора, если указано], © OKX, 2025». Часть контента может быть создана с использованием инструментов искусственного интеллекта (ИИ). Создание производных материалов и любое другое использование данной статьи не допускается.

Похожие статьи

Показать еще
Bitcoin generic thumb
Bitcoin
Research

Comparing Bitcoin and S&P 500: charts and correlation to stocks

When it comes to building a portfolio for the long haul, traders often look towards long-standing, blue-chip stocks and exchange-traded funds tracking the Standard and Poor's 500 (S&P 500). Given their time-tested narrative and popularity among institutions, it's no surprise why such assets are top picks for anyone new to the world of traditional finance (TradFi).
5 сент. 2025 г.
Средний
16
Trading indicator generic thumb
Strategies

What is implied volatility: how IV impacts crypto option premiums

Did you know that you can still lose money when trading crypto options despite prices moving in your favor? That's due to the impact of implied volatility (IV) on option premiums. With highs and lows that you usually see on roller coasters, the implied volatility of and options can be tricky to navigate for anyone new to crypto options trading.
5 сент. 2025 г.
3
Trading indicator generic thumb
Technical analysis

What is relative strength index: timing crypto reversals with RSI

Timing the market is no easy feat. However, it can be made more manageable with technical analysis and momentum indicators like the relative strength index (RSI). As one of the more popular trading indicators in a crypto trader's technical analysis arsenal, RSI lets any trader immediately determine if a coin or token is overbought or oversold at a glance. Curious about the RSI indicator and mastering its ins and outs? From learning about what RSI is to understanding how RSI works, let's dive into the world of RSI and uncover how this momentum indicator can help you make more informed crypto trading decisions.
5 сент. 2025 г.
Средний
18
Technical analysis generic thumb
Order Types

What's a limit order?

A limit order instructs a broker to buy or sell an asset at a specific price. When you place a limit order, you essentially set a price limit for the transaction. The order will be executed if the asset’s price reaches or surpasses your limit price. However, the order will not be carried out if the market price exceeds your limit.
5 сент. 2025 г.
48
Generic charts thumbnail
Strategies

What is stochastic oscillator: gauging momentum with %K and %D

As a highly volatile digital asset that's available for trading on a 24/7 basis, the crypto market can be a difficult beast to tame for even the most experienced of crypto traders. That's where momentum-based trading indicators come in handy. The stochastic oscillator is one example of such a powerful technical analysis (TA) tool that focuses on momentum — a fancy way of saying how quickly a price is moving. By understanding momentum, you can gain valuable clues about potential trend reversals and identify overbought or oversold conditions.
5 сент. 2025 г.
4
Technical analysis generic thumb
Strategies

What are take profit and stop loss: crypto's fundamental risk management tools

Take profit and stop loss (TP/SL) are trading tactics that are meant to allow you to lock in gains or minimize losses as an asset's price changes. TP/SL are frequently used by traders of all experience levels to manage risk. If you're a beginner to cryptocurrency trading, it's worthwhile to understand how to use TP/SL as a fundamental stepping stone towards more complex . We're here to help.
5 сент. 2025 г.
Для начинающих
273
Показать еще